React Components
Created a variety of component libraries for visualization, image capture, UI widgets, metric browser, and date/time picker. The components were used in a number of web apps. Customizations through CSS styles and API parameters.
Greenskeep, upgrade, and extended component libraries built by others internally.
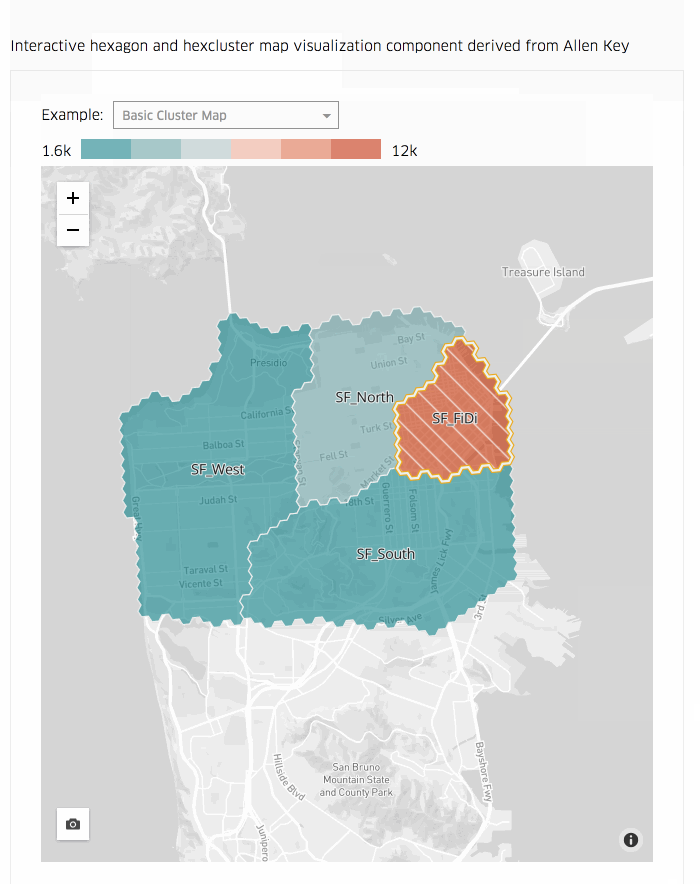
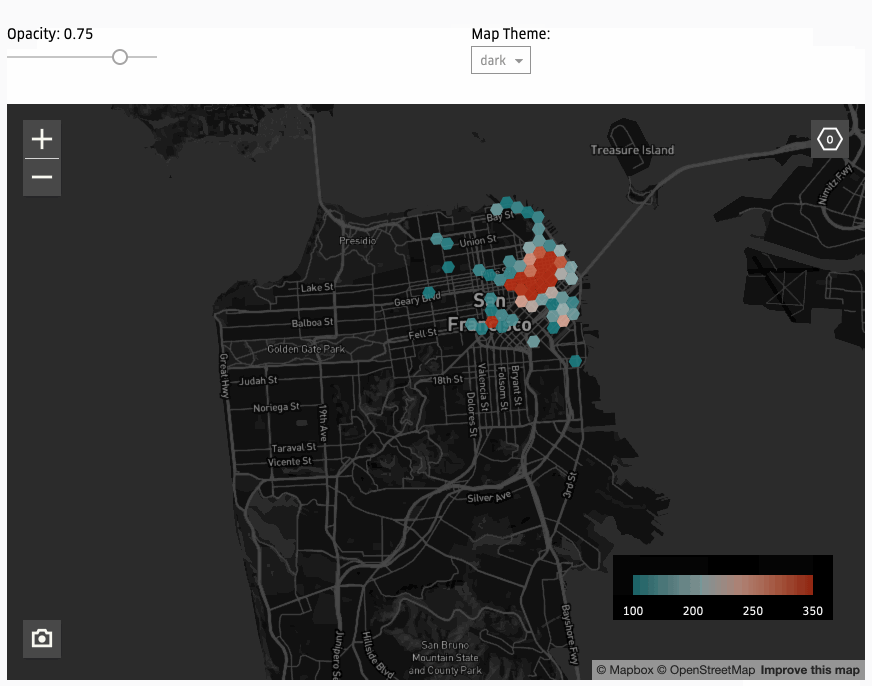
Cluster Map
An interactive H3-based cluster map. Hover and select of individual clusters indicated with colored outline highlight.
Solid color fills or pattern fills of colors to represent data values.
The first version of this component was built with svg overlays, Mapbox style, performant @uber/h3-cluster-map library (React props are memoized), and internal h3-js libraries.
In early 2020, this component was re-built using a pure deck.gl approach (using deck.gl layers) and open-sourced h3-js libraries.
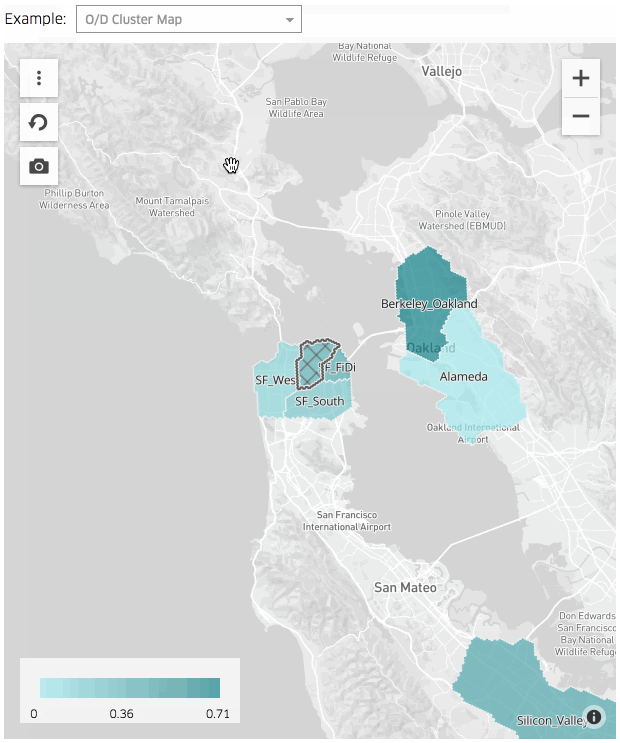
Origin, Destination Cluster Map
An interactive H3-based origin/destination map. Hover and select of hexagons indicated with colored outline highlight.
When a cluster is selected, the map switches to an origin/destination cluster map with the patterned cluster indicating origin and the colored clusters representing destinations. This visualization can display both the origin's data value and its destination data values. For example, the visualization can depict the number of trips within and across clusters.
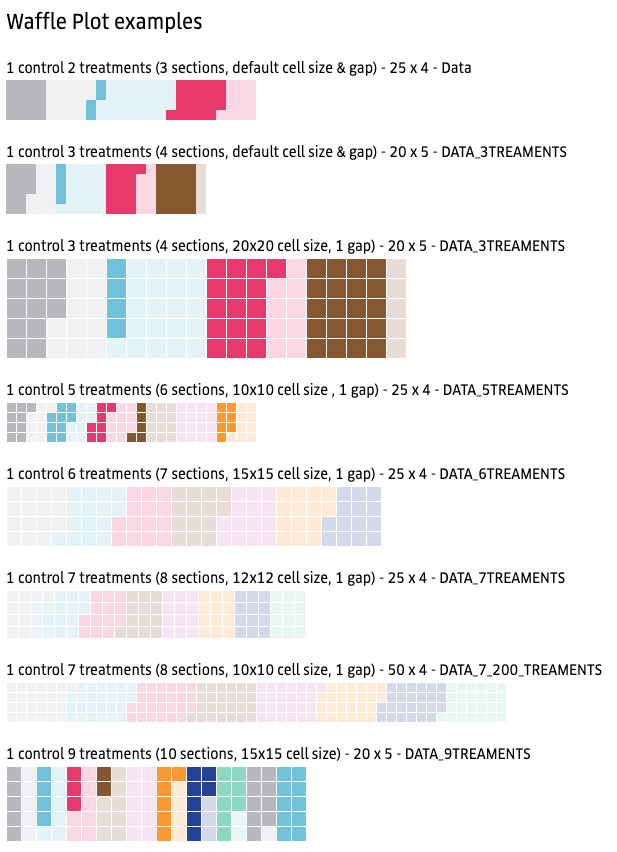
Waffle Plots
Used to communicate parts of a whole for categorical quantities. Also called square pie charts. Used in A/B experiments to indicate distributions of control and treatment group sizes. The solid and faded colors are used to indicate the size of rollout for each group
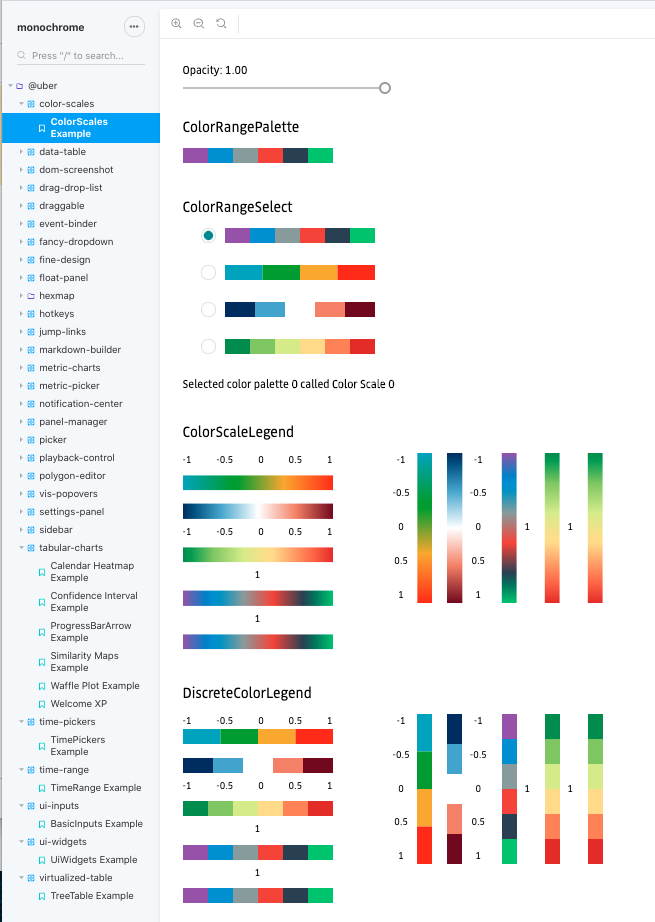
Color Scales
Several React components that render controls and/or visuals for color scales built from d3.js. The color scales can be horizontal or vertical. The visual scales can be discrete or continuous.

Similarity Plots
A 2D matrix with each cell representing the color value associated with the statistical measure for similarity of two objects.
Hexagon Map
An interactive H3-based hexagon map. Hover and select of hexagons indicated with colored outline highlight.
Different k-ring sizes may be selected that can then be used as the cursor for hover and select of group of hexagons.
In early 2020, this component was re-built using a pure deck.gl approach (using deck.gl layers) and open-sourced h3-js libraries.
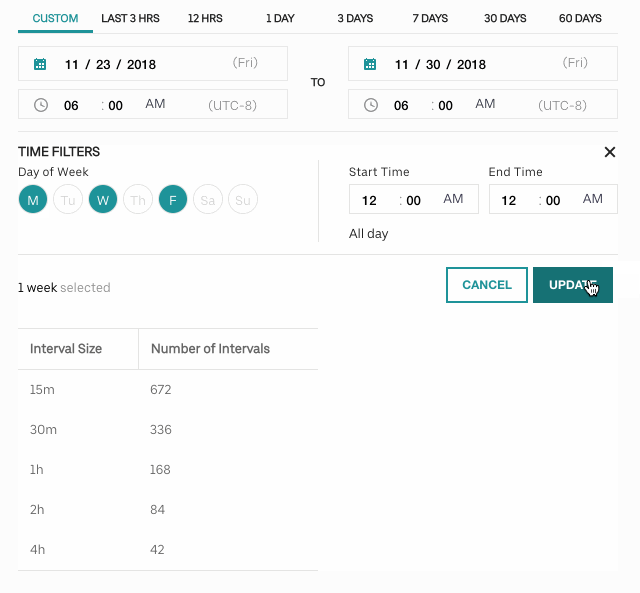
Date/Time Picker
A UI date/time control to select a date range with day of week filters. Time ranges can be selected.
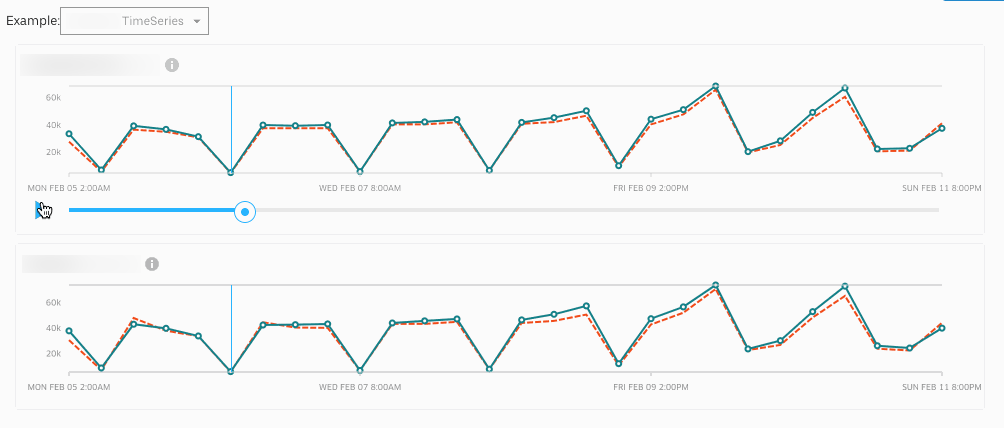
TimeSeriesChart, SplitTimeSeries
TimeSeriesChart is a single chart consisting of multiple line series or line series with bar graph. Built using react-vis (composable charting library).
SplitTimeSeries composes two more more TimeSeriesChart components. They can be stacked vertically and aligned by x-axis (see Launch Tracker project). They can be placed side-by-side. Visual styling and input data can help create a seamless chart that appears to be visually a single chart.
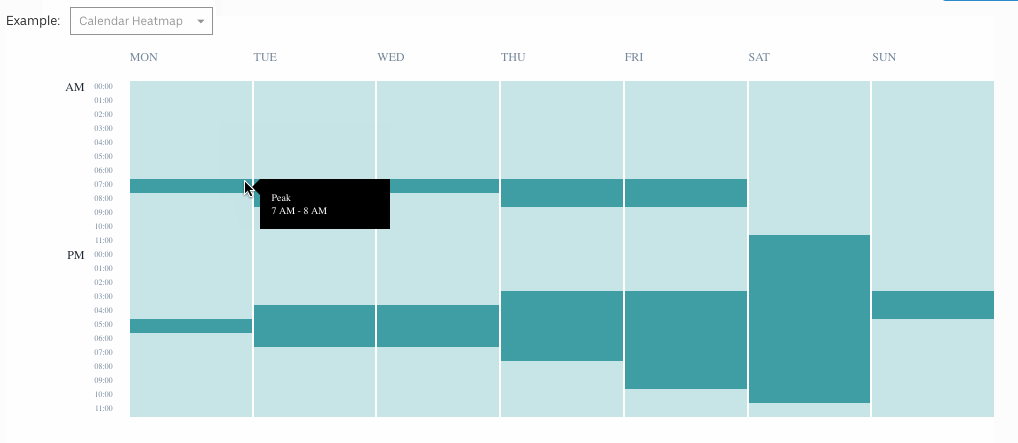
Calendar Heatmap
Hourly data for each day of the week is represented by a cell in a weekly calendar view. The view captures the 7 days of the week with each day broken down by hours of the day.