Dashboards

Allen Key
A geo-temporal Web application to explore, diagonose, understand, and troubleshoot marketplace behaviors at a city level using a number of different metrics.
Exclusive contributor to all of the following:
- to implement redesign of selected parts of the app,
- to migrate the app from flux to redux,
- to add additional functionality.
- integration with new metric directory service,
- addition of hex cluster visualizations (prior geo visualizaton was only hexagons),
- addition of customization of UI based on use case,
- addition of drag-n-drop to reorder time-series chart order,
- re-integration of ChartBuilder,
- harvest time-series and geo maps into their own component libraries.
Launch Tracker
Launch Tracker displays marketplace experiment launches. The dashboard tracks a set of key marketplace health metrics before, during, and after the experiments in effect.
Each chart displays a metric with one line series for each experiment city. Within a chart, timezone differences are accounted for when aligning time of day metric values. Metric charts are stacked vertically and aligned on time of day.
Data is fetched with a single GraphQL request for a metric. Each request consists of n sub-queries, number of countries, for metric values over the requested time period.
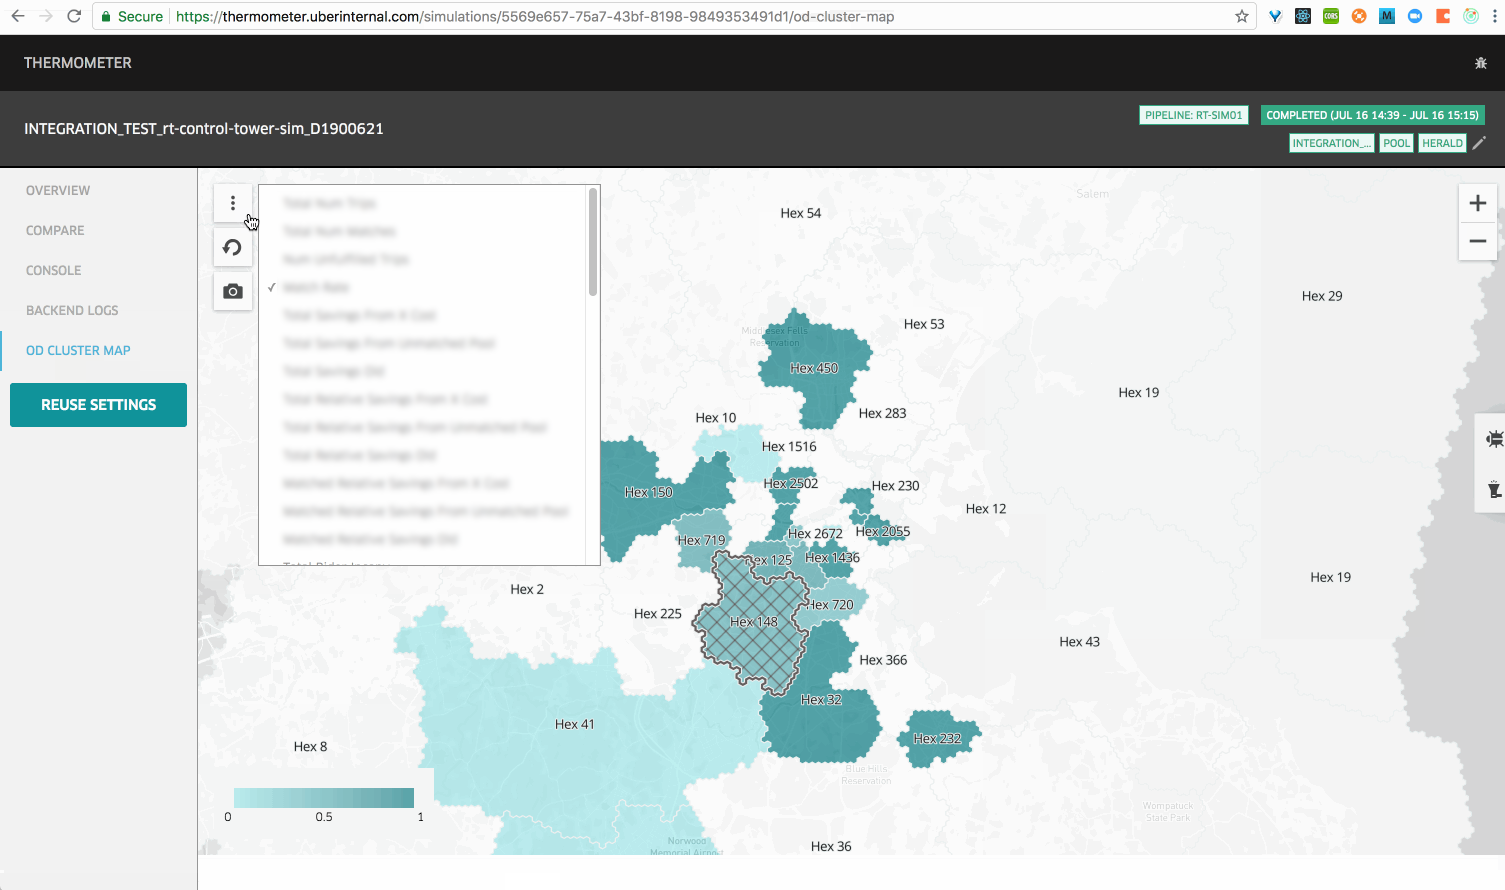
Thermometer
A simulation management dashboard for data scientists to run, to monitor, and to view outcomes of trip simulation. Results consist of changes in metric values monitored in the simulation.
Added a feature to display outcomes in an origin, destination cluster map. The map has two modes. One mode is to view metrics in each cluster. The second mode is to select an origin cluster and highlight all destination clusters.
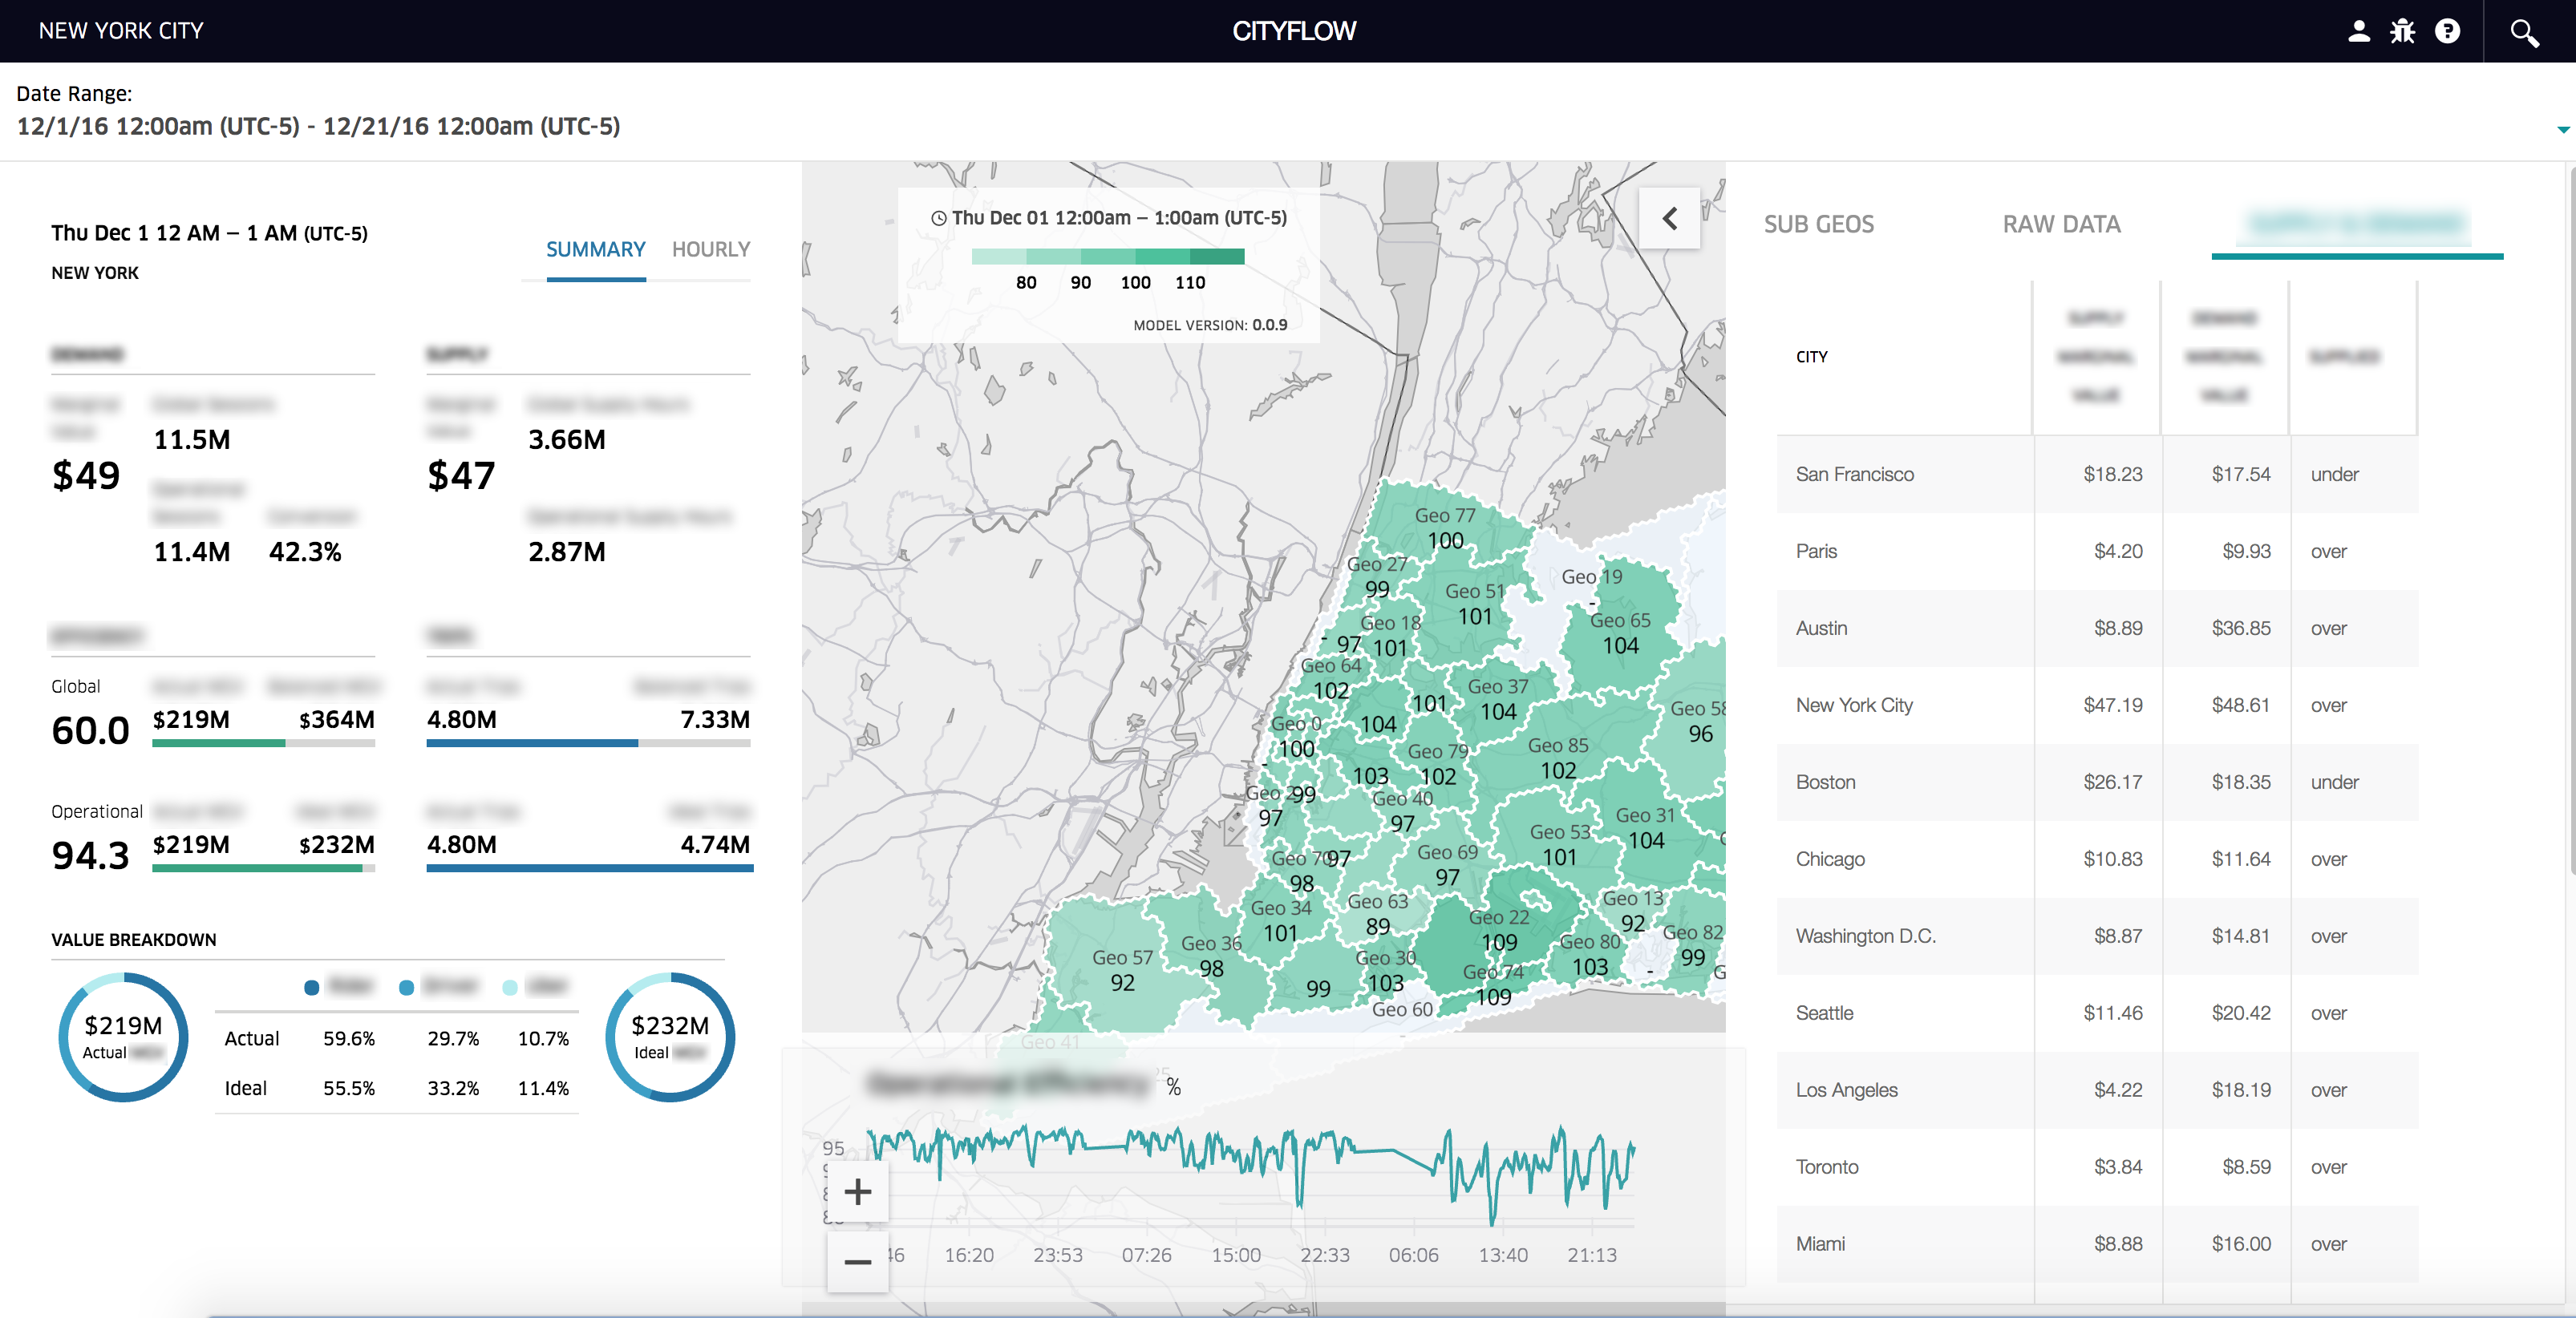
City Flow
A dashboard to explore analytic outcomes of an economic model in a city. The model was developed in collaboration with an economist.